
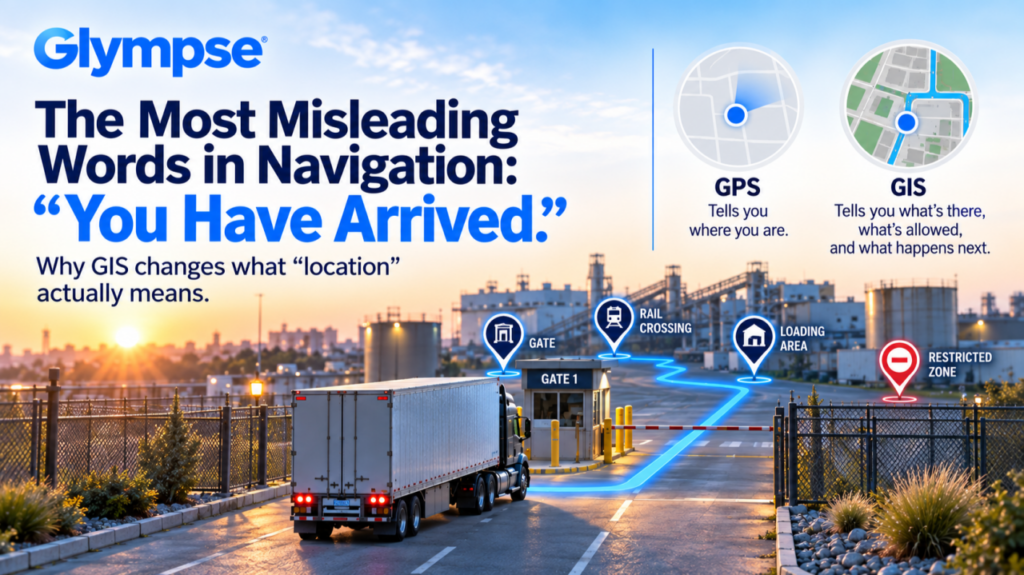
We have become remarkably good at knowing where things are. Our phones and vehicles know where we are. Fleets can see their drivers. Consumers can watch a delivery move across a screen in real time. The little blue dot has won.
But here’s the more interesting question: What does that location actually tell us?
Knowing that a truck is at a particular latitude and longitude is useful. Knowing that the truck is on a private industrial road, approaching a rail crossing, headed toward a specific loading area, traveling on an approved route and has been inside the facility for 37 minutes is something entirely different. That difference is where Geographic Information Systems (GIS) becomes incredibly powerful.
At its simplest: GPS gives us location. GIS gives that location context. But even that definition doesn’t quite do it justice. A traditional map shows us a road. A GIS can understand that the road is one-way, has a 15-mph speed limit, permits certain vehicles, connects two specific areas, crosses a rail line and may currently be unavailable.
Now add buildings. Gates. Loading areas. Restricted zones. Geofences. Vehicle locations. Traffic patterns. Dwell times. Suddenly, we’re not looking at a map. We’re looking at a digital representation of how a physical environment operates. And that’s where this gets interesting. Because sometimes a navigation system can successfully guide a truck hundreds of miles across the country, bring it directly to the entrance of a massive industrial facility and confidently announce: “You have arrived.” Geographically, that’s true. Operationally, the journey may have just begun.
The driver’s actual destination could still be two miles away, through a private network of roads, gates, rail crossings, staging areas, loading zones and restrictions that traditional public maps were never designed to understand. And that is a very different mapping problem. So, let’s break down GIS without requiring a geography degree to understand it.
Think of GIS as layers
One of the easiest ways to understand GIS is to stop thinking about a map as one picture. Instead, imagine a series of transparent layers stacked on top of one another. One layer might contain roads. Another contains buildings. Another shows gates and entrances. Another identifies restricted areas. Another contains rail crossings. Another shows loading zones. Another contains live vehicle locations. Another tracks where vehicles have been and how long they stayed there.
Individually, each layer tells you something. Together, they begin to tell you what is actually happening. That distinction matters because the physical world is considerably more complicated than the road network most of us see on our phones.
Public roads are only part of the journey
Consumer navigation systems are extraordinary at what they were designed to do: move people through public road networks. But an industrial facility isn’t necessarily a continuation of that public road network. It can be its own transportation ecosystem.
Consider a steel mill, manufacturing plant, distribution center, port or sprawling industrial campus. There may be roads that don’t appear on public maps at all. There may be roads that technically exist but aren’t appropriate for a 53-foot trailer. There may be gates designated for specific carriers, loading areas for specific products, temporary closures, weight restrictions, rail crossings and areas where certain vehicles simply should not go.
The shortest route isn’t necessarily the right route. And suddenly, routing becomes much more than Point A to Point B. It becomes more like Point A to the correct gate to the correct road to the correct staging area to the correct loading location. All safely and efficiently. That requires context.
GIS becomes even more powerful when things start moving
This is where location technology and GIS become particularly interesting. A static GIS can tell us what exists in an environment. Add real-time location, and now we can begin to understand what is happening inside that environment.
Where is the truck? Where is it supposed to be? Which route is it taking? Has it entered a geofence? How long has it been there? Is it approaching the correct loading area? Where are vehicles beginning to accumulate? Where is dwell increasing?
Now the map isn’t simply describing the facility, it’s helping describe the operation. And over time, those movements can reveal patterns that are difficult to see when operational data lives in separate systems, spreadsheets or individual observations.
The real opportunity isn’t the dot
For years, location technology has understandably focused on answering one question: Where is it? Don’t get me wrong, that’s still important. But increasingly, the more valuable questions are: Where is it relative to everything else? What is supposed to happen next? How long has it been there? Is it where it should be? And what can we learn from the way things are moving?
That’s the evolution I find fascinating because location by itself is a coordinate. Location combined with context becomes information.And location, context and time together can start becoming operational intelligence.
So yes, the little blue dot won. Now we’re teaching it to understand the world around it.