According to one recent study, data volumes aren’t just growing – they’re exploding. As of 2022, roughly 2.5 quintillion new bytes worth of data are created every single day.
Yet at the same time, data volumes are getting to the point where simply making sense of it all can be an uphill battle. Unless you have a way to wade through that data – to uncover the true narrative hidden underneath – it won’t have anywhere near the effect that you’d hoped it would.
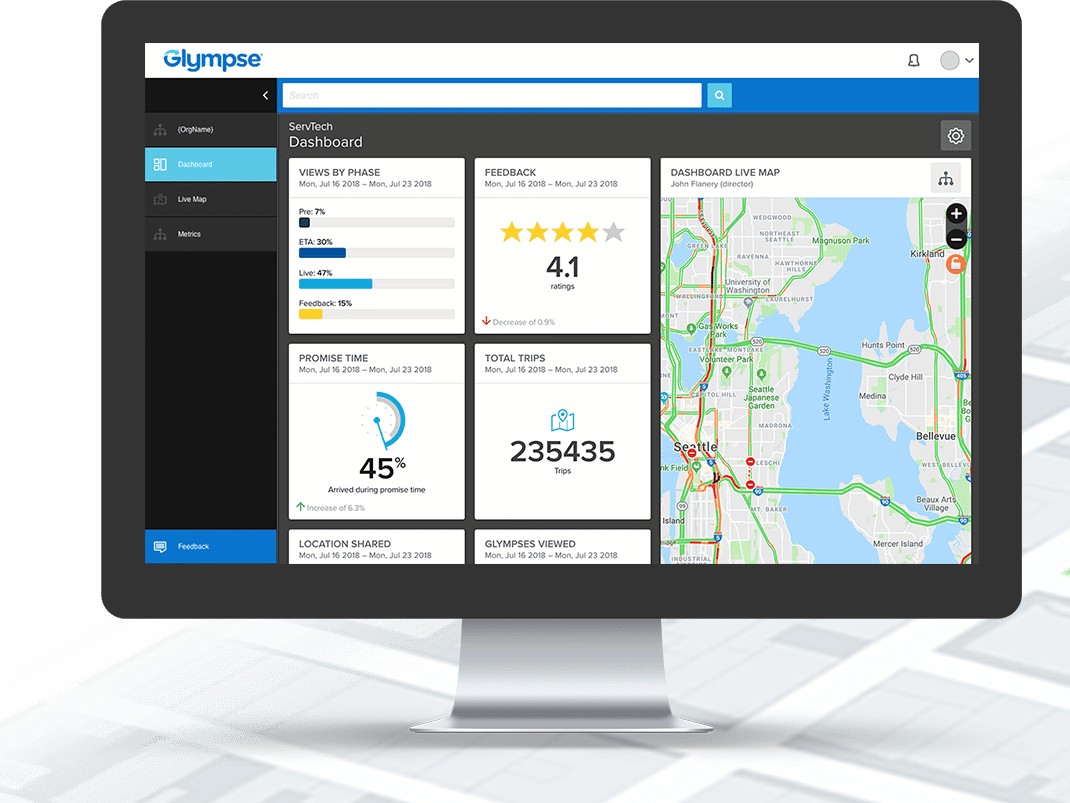
That’s why the analytical and reporting functionality built into a real-time logistics solution like Glympse are so essential. Not only do they help you uncover those trends and patterns you need to be aware of, but they also help you use them in a way that finally puts that data to good use.
The Power of Data Visualization and Analytics: Breaking Things Down

All told, Glympse is designed to give customers access to productivity, performance, and customer-driven insights – all to create as much transparency about different areas of their operations as possible.
Take productivity, for example. Just a few of the metrics that Glympse offers include ones like:
- Jobs Per Day. This breaks down not only all completed jobs in a given period, but ones that a driver may have missed as well.
- Dispatch Time. This refers to the amount of time that it took after a job assignment was created for an employee to be officially on-the-way to the customer.
- To-The-Door Time. This refers to the amount of time it takes someone to get from one job to the next.
- Time on Site. As the term implies, this involves the actual time someone spent offering service at a customer’s location.
- Unproductive Time. This is the amount of time an employee is spending with no active jobs, or no jobs scheduled.
- Driver Delay. This includes the time that delivery or service is being provided outside the expected time.
Yes, it’s invaluable to know things like when a customer places an order, when that product ships, and how long it takes before it has arrived at their doorstep. But metrics like those outlined above also allow you to go a fair bit deeper, getting a true indication of the parts of your operations that people are excelling at and which ones could use a little more attention.
You could have a 100% success rate in terms of completed jobs per day, for example, and still have opportunities for efficiency improvements if the dispatch time or the to-the-door time are too high. Likewise, if you’re seeing a spike in the amount of jobs that are being missed, metrics like time on site or unproductive time could help provide an explanation as to why.
The same is true of things like customer insights, too. Glympse allows you to take a closer look at metrics like:

- Customer Wait Time, meaning the amount of time someone is spending waiting for a service to be performed or for a delivery to arrive.
- Customer Ratings, which are the customer’s own score as it pertains to their service experience.
- Customer Feedback, which is any additional feedback that they offer.
If customer scores are going down and customer wait times are on the rise, you can clearly see a direct relationship between these two ideas. They provide an essential context that you may not otherwise have access to if you’re simply going from real-time status or predicted ETAs alone.
In the end, real-time visibility is great for any business in terms of improving productivity, efficiency, and sustainability. But it is also just one small part of a much larger story. Equally important is your ability to use that data to track the impact of your efforts over time. That’s one of the biggest services that Glympse provides, and it’s one that our own clients have shown time and again that they’re able to use to great effect.
If you’d like to find out more information about how to harness the power of real-time visibility in logistics to your advantage, or if you’d just like to talk to someone about your own needs in a bit more detail, please contact our team at Glympse today.
